
February 2025: Reno/Sparks Housing Market
Reno, NV Metro Area median SFR home price continues to slide. Sales rebound. Condo sales surge!
The median SFR home price fell again in February—coming in at $567,750—a 1.0% decline from January’s median.
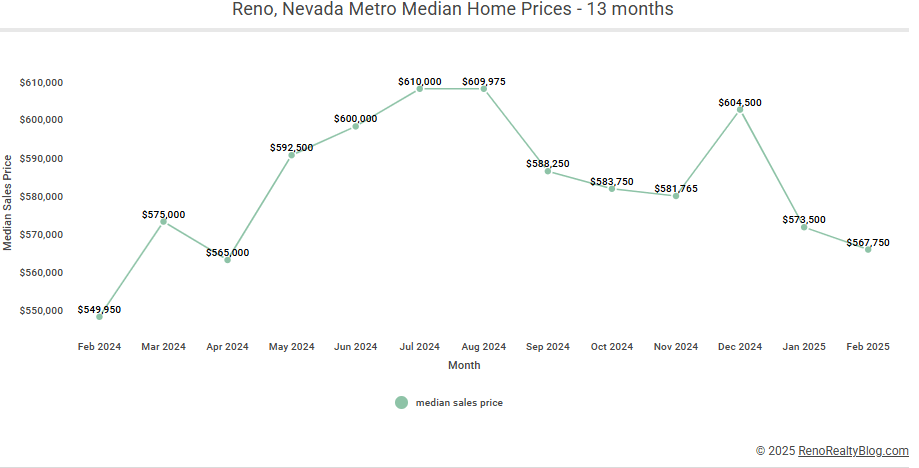
The median sales price is now nearly back to March 2024 levels. Year-over-year, February’s median is up 3.2%.
The median sold price per square foot (PPSF) saw a slight increase in February 2025—climbing 0.4% from January’s number. Year-over-year, however, February’s median sold PPSF of $313.13/sq.ft. is down 1.3%.
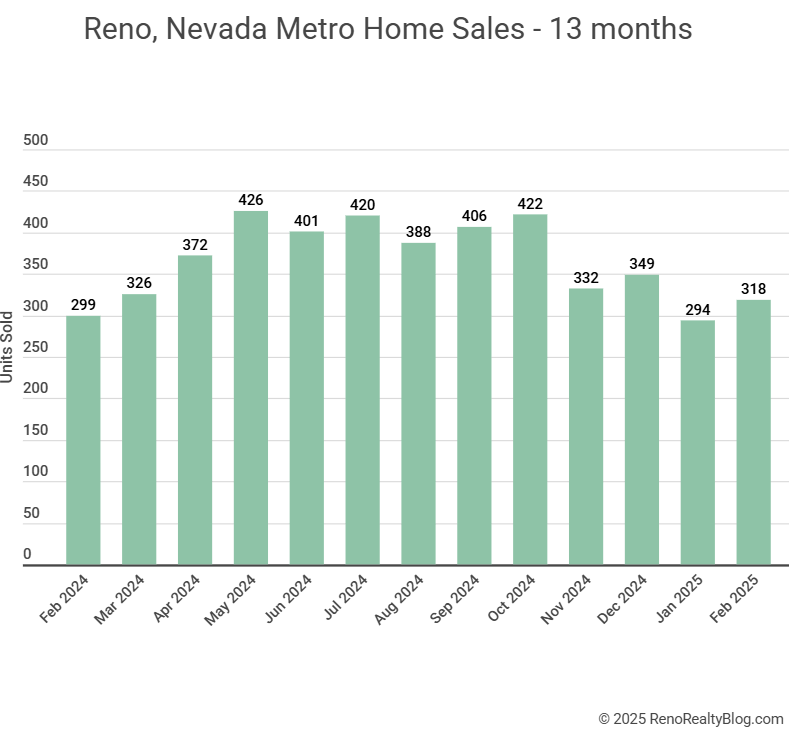
Home sales rose in February. February saw 318 SFR units sold—a healthy 82% increase over January’s 294 units sold. Year-over-year, February’s unit sales were up 6.4%.
Available inventory of homes listed and available for purchase currently sits at 680 units—up 3.8% over this time last month; and also up a robust 39.3% over this time last year.
Pending sales are on the rise. There are currently 502 SFRs pending sale. This number is up 9.6% over this time last month and year-over-year.
February’s months’ supply of inventory (MSI) came in at 2.1 months of supply—nearly unchanged from January’s 2.2 MSI. This figure, indicative of a seller’s market, is calculated by dividing the available inventory by the number of homes sold last month. A balanced market is generally considered to be between four and six months of supply.
February’s median days on market (DOM) clocked in at 72 days—14 fewer days than January’s median DOM. Year-over-year, February’s DOM was one day fewer than February 2024’s DOM number.
The quartile chart below shows the trends within the 1st, 2nd, and 3rd quartiles of monthly sale prices spanning the most recent 13 months.
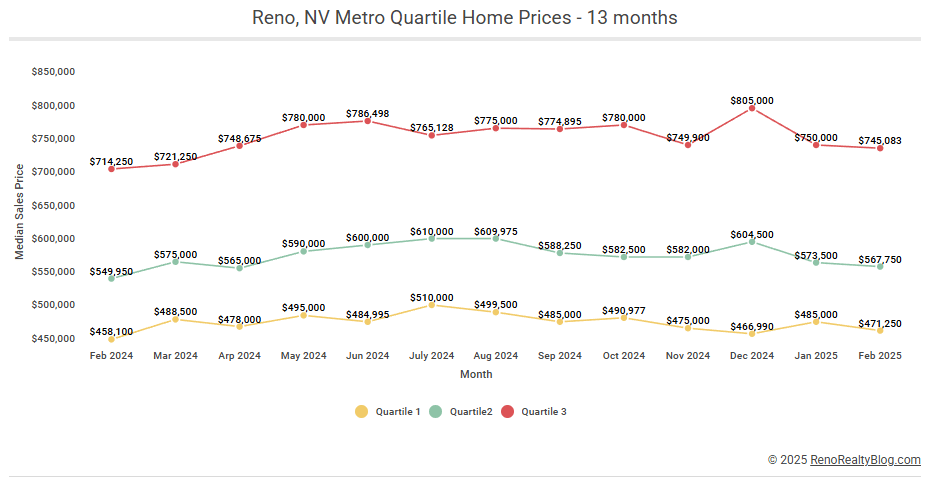
This interactive chart allows readers to compare sales price trends across quartiles.
The median sales price for condo/townhomes saw a notable increase in February—coming in at $395,000. This number represents a whopping 16.5% increase over January’s median; and is also up 17.9% year-over-year.
February’s condo/townhome unit sales were also up. 71 condo/townhomes sold in February a 7.6% increase over January’s sales; however down 6.6% year-over-year.
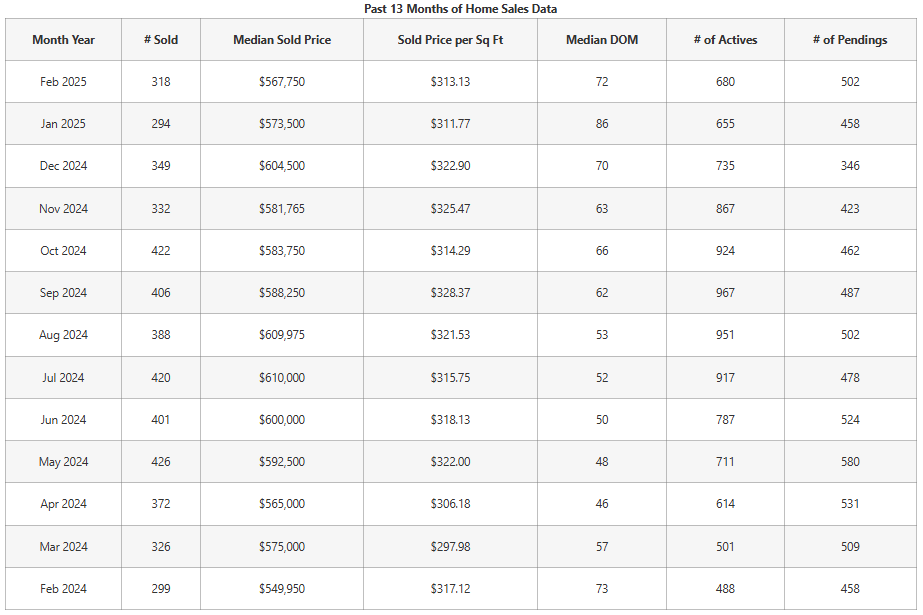
13 Months of SFR Sales Data
The table below contains the past 13 months of data
February 2025’s market data reveals a complex landscape within the Reno/Sparks metro area. While median home prices continue a slight downward trend, a significant rebound in sales and pending listings indicates renewed buyer activity. The persistent seller’s market, evidenced by low MSI, suggests that well-priced homes are still in high demand. The notable surge in condo/townhome prices and sales further highlights the diverse nature of this market. As we move into the spring season, it will be crucial to monitor inventory levels and buyer sentiment to see if these trends solidify or shift. Staying informed and working with a local real estate expert remains vital for navigating this dynamic market.